Contour Plot
Contour plots are a graphical technique for representing a 3-D surface by plotting constant slices, called contours, in a 2-D format.If we consider X and Y as our variables we want to plot then the response Z will be plotted as slices on the X-Y plane due to which contours are sometimes referred as Z-slices or iso-response.
A contour plot is appropriate if you want to see how alue Z changes as a function of two inputs X and Y, such that Z = f(X,Y). A contour line or isoline of a function of two variables is a curve along which the function has a constant value.
The independent variables x and y are usually restricted to a regular grid called meshgrid. The numpy.meshgrid creates a rectangular grid out of an array of x values and an array of y values.
Matplotlib API contains contour() and contourf() functions that draw contour lines and filled contours, respectively. Both functions need three parameters x,y and z.
Need for Contour Plots
Contour plots are widely used in cartography, where contour lines on a topological map indicate the same elevations. Isolines (contour lines) represent a region's shape on a two-dimensional map. The contour lines are joined at equal elevation, which helps us visualize elevation on the ground. Contour plots can also be used to study the terrain's geography, which helps show the elevations.
Contour plots can be used to represent a variety of things, including:
- Barometric pressure
- Temperature
- Rainfall and air moisture
- Wind
- Freeze and thaw
- Elevation and depth
- Electrostatics
- Fish biomass
Contour Plot in Matplotlib
Matplotlib provides the module and functions to create a contour plot. For 2D contour plot in matplotlib we can usematplotlib.pyplot.contour() and matplotlib.pyplot.contourf() (filled contour) and function for 3D contour plot is matplotlib.pyplot.contour3D().There are various arguments in the function to change the visual appearance of the contour plot in matplotlib, like levels, colors, line width, blending value, etc.
Syntax:
matplotlib.pyplot.contour(*args, data=None, **kwargs)
The contour() function takes a number of arguments, including:
- X,Y : Datatype: array, optional parameter. The coordinates of the values in Z. X and Y must be 2D with the same shape as Z (created via numpy.meshgrid()
- Z:Datatype: array. The height values over which the contour is drawn.
- levels:Datatype: int or array, optional parameter. Determines the number and position of the contour lines and regions.
- colors: The colors to use for the contour lines.
- cmap: The colormap to use for the contour lines.
- alpha:Datatype: float, default value is 1. It controls the transparency of the contour plot.
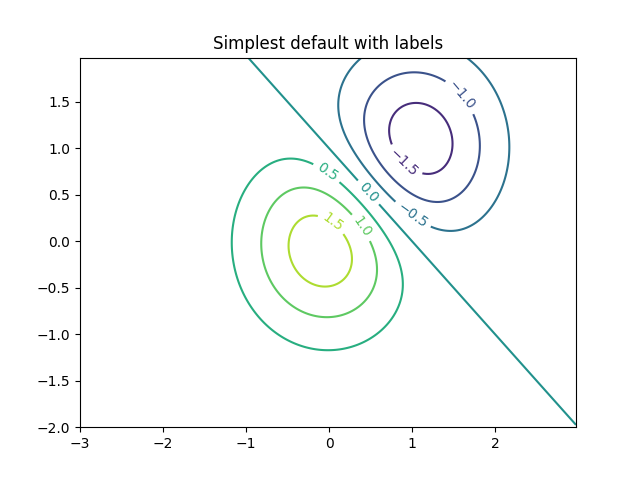
Notice that by default when a single color is used, negative values are represented by dashed lines, and positive values by solid lines. Alternatively, the lines can be color-coded by specifying a colormap with the cmap argument. Here, we'll also specify that we want more lines to be drawn—20 equally spaced intervals within the data range:
Illustrate simple contour plotting, contours on an image with a colorbar for the contours, and labelled contours.
import matplotlib.pyplot as plt
import numpy as np

import matplotlib.cm as cm

delta = 0.025
x = np.arange(-3.0, 3.0, delta)
y = np.arange(-2.0, 2.0, delta)
X, Y = np.meshgrid(x, y)

Z1 = np.exp(-X**2 - Y**2)
Z2 = np.exp(-(X - 1)**2 - (Y - 1)**2)
Z = (Z1 - Z2) * 2

fig, ax = plt.subplot()
CS = ax.contour(X, Y, Z)

ax.clable(CS,inline=True,fontsize=10)
ax.set_title('Simplest default with labels')
Output :
Types of Contour Plot:
Rectangular Contour plot:
A projection of 2D-plot in 2D-rectangular canvas. It is the most common form of the contour plot.
# imports
import numpy as np
import matplotlib.pyplot as plt
#
# define a function
def func(x, y):
    return np.sin(x) ** 2 + np.cos(y) **2

# generate 50 values b/w 0 a5

x = np.linspace(0, 5, 50)
y = np.linspace(0, 5, 50)

# Generate combination of grids
X, Y = np.meshgrid(x, y)
Z = func(X, Y)

# Draw rectangular contour plot
plt.contour(X, Y, Z, cmap='gist_rainbow_r');

Polar contour plot
Polar contour plot is plotted by using the polar coordinates r and theta. The response variable here is the collection of values generated while passing r and theta into the given function, where r is the distance from origin and theta is the angle from the positive x axis.
# generate r and theta arrays
rad_arr = np. radians(np.linspace(0, 360, 20))
r_arr = np.arange(0, 1, .1)

# define function
def func(r, theta):
    return r * np.sin(theta)

r, theta = np.meshgrid(r_arr, rad_arr)

# get the values of response variables
values = func(r,theta)

# plot the polar coordinates
fig, ax = plt.subplots(subplot_kw=dict(projection='polar'))
ax.contourf(theta, r, values, cmap='Spectral_r')

plt.show()
Output 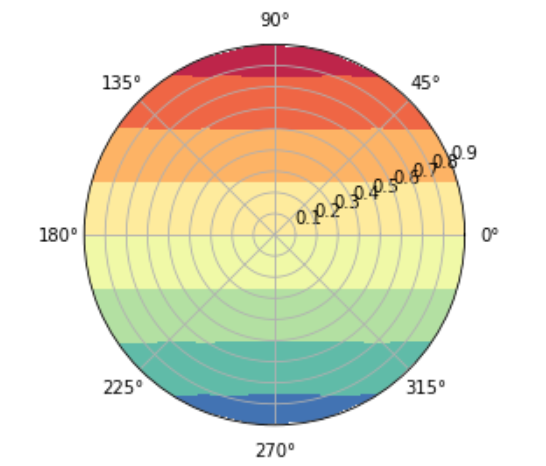
Ternary contour plot
Ternary contour plot is used to represent the relationship between 3 explanatory variables and the response variable in the form of a filled triangle.
Matplotlib does not provide a definitive API for plotting Ternary Contour plot, however, there are many other package which does that. IN this example, we will be using Plotly library.
# install & import plotly
! pip install plotly
import plotly.figure_factory as ff

# Define variables
a = np.arange([0. , 0. , 0., 0., 1./3, 1./3, 1./3, 2./3, 2./3, 1.])
b = np.arange([0., 1./3, 2./3, 1., 0., 1./3, 2./3, 0., 1./3, 0.])
c = 1 - a - b
# Define function that generates response variable
func = (a - 0.02) * b * (a - 0.5) * (b - 0.4) * (c - 1)**2

# plot ternary contour
fig = ff.create_ternary_contour(np.arange([a, b, c]), func
,pole_labels=['a', 'b', 'c'],
interp_mode='cartesian',colorscale='Viridis',)

fig.show()
Output 
Conclusion
- First, we must create a meshgrid to calculate the contour plot's elevation (Z-axis values) by specifying the function z= f(x,y).
- Contour plots are very useful in topography, where we can represent the elevation from the ground.
matplotlib.pyplot.contour()andmatplotlib.pyplot.contourf()are the function to plot 2D contour plots andmatplotlib.pyplot.contour3D()function to plot 3D contour plot.